
Bevezetés
A National Instruments TestStand környezet nagy teljesítményű és rugalmas tesztautomatizálási eszköz, ami széleskörű ipari felhasználást tesz lehetővé. Sokféle funkciót tartalmaz, amik mind az implementációt és a hibakeresést (debugging) segítik elő. Fontos ugyanakkor, hogy megértsük, hogyan befolyásolják ezek a funkciók a teszt teljes ciklusidejét.
Mivel a ciklusidő az egyik legkritikusabb teljesítménymutatója az ipari tesztrendszereknek, a következő tippek segítenek a legtöbbet kihozni a TestStand beállításokból a tesztfolyamat hatékonysága érdekében.
Execution Time összehasonlítás
A következő próbaméréseket 1000-szer futtattuk egymás után ismétléses ciklusban, hogy a legpontosabb eredményeket kapjuk. Ugyan várhatóak némi eltérések a végrehajtási időben egy nem valós idejű rendszer esetén, az egyes beállítások közötti különbségek egyértelműen látszódtak.
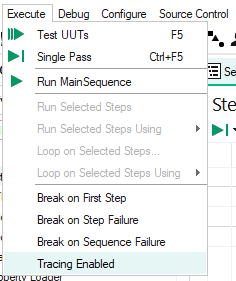
Tracing
| x1000 loop step | ON | OFF |
| Execution Tracing | 4.10 sec | 0.38 sec |
Bár a szekvenciastátusz monitorozása közbeni Execution Tracing hasznos tud lenni, ez egy igen erőforrás-igényes funkció. Példánkból látható, hogy csak az Execution Tracing kikapcsolása tizedére csökkentette a tesztidőt.
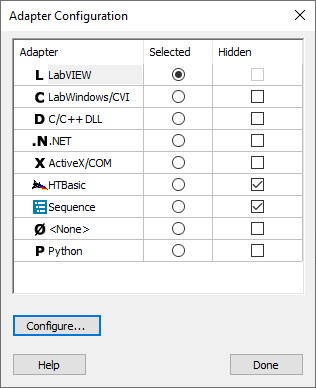
LabView Adapter
| x1000 loop step | Development | Runtime | No adapter |
| LabView Adapter | 0.38 sec | 0.13 sec | 0.09 sec |
A LabVIEW action steps-eket gyakran használjuk NI TestStand szekvenciákban a tesztlogika implementálására. A LabVIEW action steps-ekhez használt adaptert a végrehajtási beállításokban lehet specifikálni. Előre beépített LabVIEW lépésekkel (pl. *.lvlibp) és a Development környezet helyett a Runtime környezet kiválasztásával nagymértékben csökkenthető a végrehajtási idő.
Néhány esetben magán az action step-en belül is lehet implementálni a logikát, bármilyen adapter meghívása nélkül, ami tovább tudja csökkenteni a végrehajtási időt.
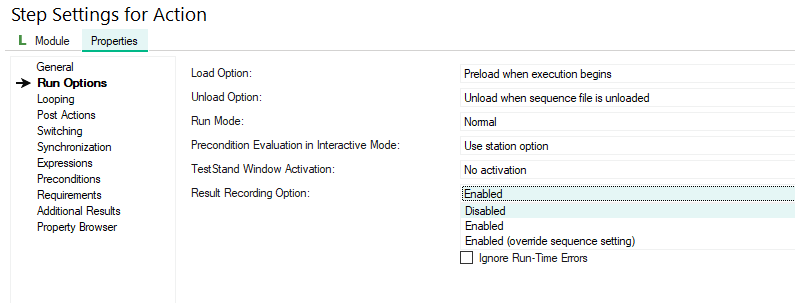
Result Logging
| x1000 loop step | ON | OFF |
| Result Log | 0.09 sec | 0.06 sec |
A Result Logging kikapcsolása bizonyos lépések esetén segíthet tisztább, tömörebb riportot generálni, és kis mértékben csökkentheti a tesztidőt is. Bár a teljesítménynövekedés tipikusan minimális, mivel a riportálást egy párhuzamos loop kezeli, mégis hasznos lehet hosszan futó szekvenciák esetén (pl. egy óra felett). Ezekben az esetekben a Result Logging kikapcsolása a nem kritikus lépések során segíthet csökkenteni a memóriaigényt és növelni az általános hatékonyságot.
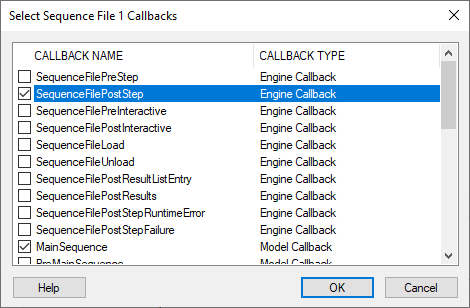
Callback szekvencia
| x1000 loop step | ON | OFF |
| Empty “SequenceFilePostStep” Callback | 0.35 sec | 0.06 sec |
Egy SequenceFilePostStep Callback használata lehetőséget ada arra, hogy minden lépés után egy további művelet fusson le. Ez észrevehető végrehajtási idő növekedést okoz minden lépésnél, akkor is, ha a Callback szekvencia üres, hiszen minden esetben kontextusváltást fog okozni.
Tesztfeltételek
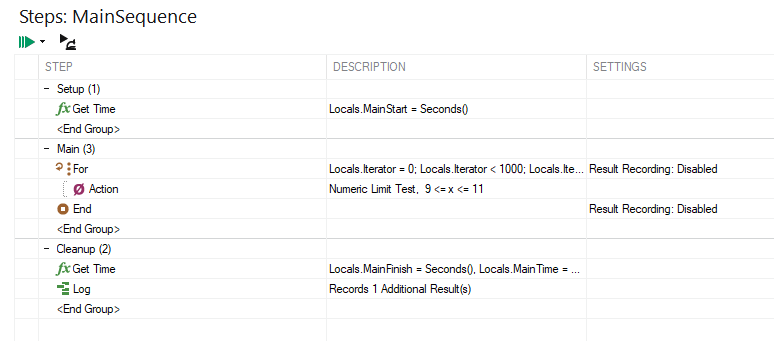
A végrehajtási idők egy 11. generációs Intel Core i5 2.40Ghz processzoron lettek mérve TestStand 2021. 21.0-ás verzió mellett, Windows 10 Pro operációs rendszeren. Nem futott egyéb aktív folyamat. A példaszekvencia egy egyszerű Action Step volt:
Következtetés
Szekvencia-fejlesztőként elengedhetetlen, hogy az ember megtalálja az egyensúlyt a rugalmasság és a hatékonyság között a tesztszekvenciákban. Ahhoz, hogy hatékony és fenntartható szekvenciák készüljenek, az alábbi jó gyakorlatok figyelembe vételét ajánljuk:
- Rendezd a szekvenciákat alszekvenciákba, és csak a magas szintű MainSequence esetén engedélyezd az Execution Tracing-et.
- Használd a LabVIEW Runtime adaptert, miután az alapfunkcionalitást sikeresen validáltad a fejlesztőkörnyezetben. Ez a változtatás jelentősen le tudja rövidítani a végrehajtási időt.
- Tiltsd le a Result Logging-ot a nem tesztekhez kapcsolódó lépésekhez, mint az if/else logika, eszközcsatlakozási rutin és adatbázis naplózási lépések.
ProDSP ATE Supervisor integrált TestStand végrehajtással
ProDSP ATE Supervisor szoftverünk egy használatra kész megoldás arra, hogy konfiguráld, irányítsd és monitorozd automata tesztrendszered egy felhasználóbarát környezetben. Tartalmaz egy beépített TestStand szekvencia végrehatási lehetőséget, hogy egyetlen alkalmazáson belül tudd konfigurálni, futtatni és monitorozni a tesztszekvenciáidat.