Validation of End-of-Line tester measurement systems
In any serial production process, quality control of finished or semi-finished products is essential to ensure consistent production quality. For highly automated production lines, this is typically achieved using a computerised measuring system integrated into the production line or a separate automated measuring system. Depending on the required quality standards , each product or a random sample is checked according to a predefined protocol. The measuring equipment must also be validated to ensure that the entire process complies with quality requirements . ThisThis validation generally falls into two categories : one-time inspection upon system initiation and periodic inspection. Several methods have been used in the industry to cover these activities, but we focus on the statistical validation methods presented below.
Measurement System Analysis (MSA)
MSA refers to the measurement procedures used to qualify the validation and analysis of various measurement systems and manufacturing processes. In the following, we focus only on indicators and procedures related to the validation of measurement systems .
The main sources of deviation in measurements are:
- Measuring instrument
- Human resource/operator
- Measurement method
Commonly used terms:
- Repeatability = EV - Equipment Variation (same measurement, same DUT, same operator)
- Reproducibility = AV - Appraiser Variation (same measurement, same DUT, different operators)
- GRR = Gage R&R = Gage repeatability and reproducibility
- PV = Part Variation
- TV = Total Variation
- Capability index = Cp
Definition of Stability
The most fundamental property of measuring instruments is their long-term stability. To measure this, it is essential to have a sample with values that are accepted as a reference. If such a reference sample is unavailable, a production sample with values falling in the middle of the measurement range can be accepted and considered as the reference point. It is also preferred to have golden samples chosen from the lower and upper ends of the measurement range. These samples should be re-measured at regular intervals to verify the correct functioning of the measurement system.
There is no specific metric to characterize stability, but it is common practice to plot the values and standard deviations of the measurements over time on graphs.
Bias / accuracy determination (Independent Sample Method)
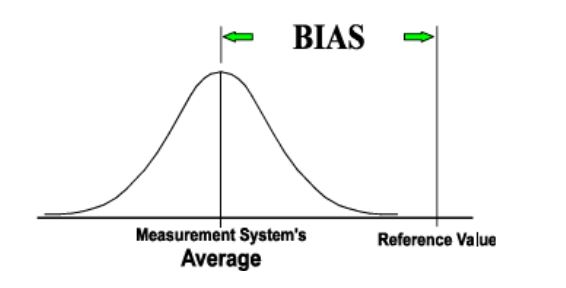
Take a golden sample, measure it at least ten times and calculate the average of these measurements, use this as a reference value.
An operator should take at least ten measurements on a sample. The bias associated with reading is the deviation of these measurements from the reference value, which should be plotted on a histogram.

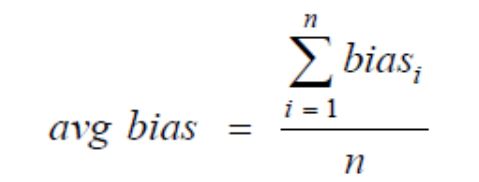
Averaging the bias values of each reading gives the average bias value for the measurement system.
The measured values can also be used to determine the standard deviation of repeatability.

Based on this data, further calculations can be made to determine whether the bias falls within the required confidence interval, and thus whether the system’s accuracy meets the required specifications.
If the determined bias value is not statistically zero, this may be due to the following reasons:
- The reference value is incorrect
- A measuring instrument is not functioning properly
- The instrument is not suitable for the measurement
- The instrument is measuring the wrong characteristic
- The instrument is not properly calibrated
- The instrument is not used properly by the operator
If it is impossible to achieve a zero-bias value by recalibrating the instrument, the readings can be corrected by the bias value. Due to the higher risk, this requires customer approval.
Defining Linearity
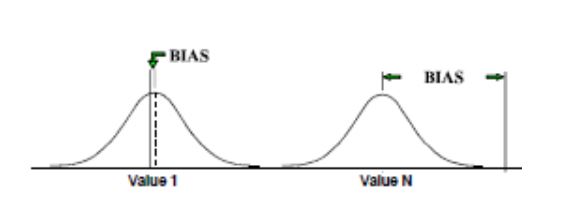
Linearity definition shall include the measurements of at least five samples covering the operating range of the measuring instrument (there are multiple reference values). At least ten measurements shall be conducted for each sample, with random selection, by the same operator.
The method described above shall be used to calculate the measurement bias for each sample. If our measurement system has the same bias for each different sample (reference value) and the bias is zero (within a suitable interval) then the linearity of our system is adequate.
The bias of the measured values can also be plotted graphically, highlighting issues with linearity even if the average bias values do not show them.
Determining Repeatability and Reproducibility (Gauge R&R)
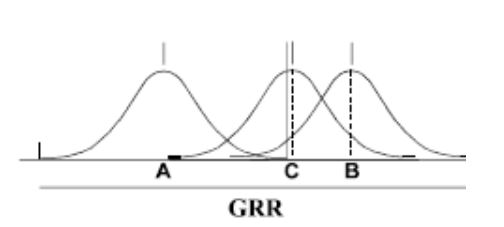
The reproducibility indicator usually sums up the variations caused by different operators. If there is no human intervention in a measurement system, and all product handling, movement and measurements are performed by the same machine, the reproducibility indicator can be considered zero. In this case, only repeatability tests can be performed. The following is an overview of the methods defined by the MSA standard.
Range Method
This method provides an approximation of the variability of the measurement, only an overall picture of the measurement system, and unspecific information on the repeatability and reproducibility indicators. It is used to check whether the GRR has changed. Usually, two operators and five samples are used for the test. Each operator tests each sample once. The range for each product is the difference between the values measured by the two operators. The average of these can be used to calculate the GRR for this method and measurement. It is possible to check how much our process deviates from the standard deviation and, if necessary, to improve the measurement system.
Average and Range Method
This method estimates the repeatability and reproducibility of our measurement system but does not consider the variations due to the interaction between the operator and the product/instrument. Many operators measure several products multiple times independently in a random order without observing each other's measurements. It is also possible to perform this analysis with different operators in different shifts.
The measured data must be recorded in a table, and the average and range values should be calculated for each operator-product pair. These values should then be further averaged for each operator and finally for the entire process.
Based on these calculations, the EV, AV, GRR, PV, and TV values can be determined . For these, the percentage indicators (%EV, %AV, %GRR, %PV) can be calculated relative to the TV.
Plotting the measured values on different graphs to decide whether the measurement system suits the measurement process is also important.
If the data from one operator falls outside the defined limits , it means that this operator uses a different method than the others. Conversely, if all operators have values outside the limits, it is necessary to improve either the measurement system or the technique of the operators.
Analysis of Variance (ANOVA) Method
The advantage of this method is that it can estimate variances more accurately, providing more information about, for example, the effects of interaction between components and operators. However, the disadvantage is that the computational methods are much more complex than the previously described methods, requiring considerable statistical knowledge.
Steps of analysis
- Determine the number of samples to be measured (n>=5), the number of operators (k>=2) and the number of trials (r>=2). A trial means how many times an operator measures the same product.
- Select which products will be included in the trial. The sampling is appropriate when the selected products reflect the process variance reasonably well.
- Label the samples from 1 to n, and the operators as A, B, C, etc.
- Conduct the measurement: samples should arrive in random order. Operator A measures all samples in random order and records the data. Then the other operators run through all the samples, but they cannot see the other operators’ results.
- 5) Analyse measurement data (putting data into a form, applying formulas).
Evaluation of GRR
- Below 10% is generally accepted as good
- 10-30% can be considered acceptable, subject to client approval
- Above 30% is unacceptable, measurement system needs to be improved
This indicator alone is not sufficient to characterise the measurement system.
Capability Indicators
Process Capability Index (Cp and Cpk)
Capability analysis is a way to conclude measured data about whether your process is reliable and repeatable in producing products that meet expectations. When defining a manufacturing process, the goal is that the produced products should fall within a defined lower and upper (LSL, USL) limit. Capability measurements test how consistently this is achieved. The test is usually derived from a large amount of total production data collected within a specified time window. Two factors can be used to characterise the process: how close the measured data is to the specified nominal value, and whether the variance is less than the specified margin.
- Cp: this indicator measures whether the standard deviation of the process is within the specified limits
- Cpk: this indicator shows, in addition to the standard deviation, how well averaged the data are
Machine Capability Index (Cm and Cmk)
These two indicators focus on the capability data of a given machine, ignoring process-specific effects. To calculate them, 20-50 measurements in succession are required. It is essential that during data collection, no change that affects the measurement should occur, and it should not be due to the machine's characteristics. No machine shut down, operator change, part change, tool change, or change of environment can occur. This ensures that the measured deviations and errors are due to the measurement and the measuring machine.
Consequently, the Cm and Cmk indices are always higher than the Cp and Cpk indices.
Capability analysis steps (Process and Machine Capability Index)
- Ensure the conditions mentioned earlier by recording the appropriate measurement data
- Plot the data obtained on a diagram and histogram
- Calculate the difference between the upper specification limit (USL) and the lower specification limit (LSL)
- Calculate the standard deviation of the measured values
- Cp/Cm = (USL-LSL)/(6*standard deviation)
Cpk/Cmk számítása:
Calculate the mean and standard deviation of the measured data. L ook at the deviation of the mean from the upper and lower limits divided by the three standard deviations and eliminate the smallest of these.

An example and help for the calculation is available in the attached table CMK Analysis.
Capability indicator illustration
Plotting the measured values on a histogram and a time plot to analyse their distribution is useful. Optimally, the measured values should fall in the middle of the range of goodness-of-fit with a narrow spread.
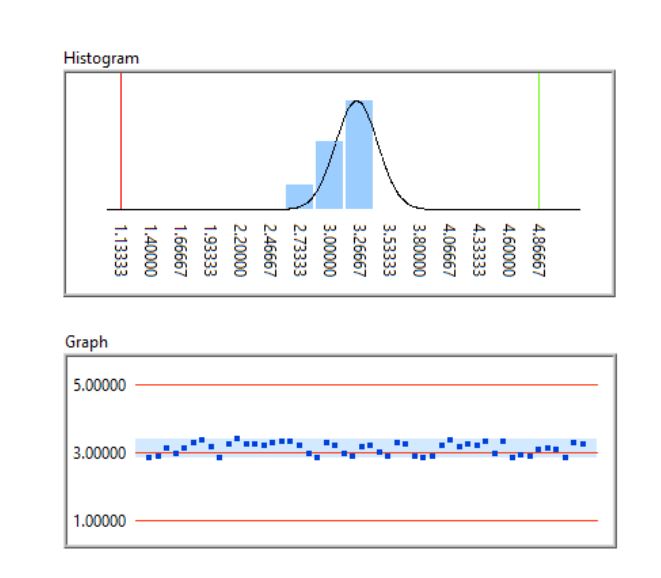
Example of an optimal distribution (Cp: 3.7, Cpk: 3.5)
In this case, we can state that the process is stable with a high confidence level, so we will not get incorrect measurements in the future. If the standard deviation of the measurements increases, we get a less concentrated histogram and the Cp and Cpk values decrease:
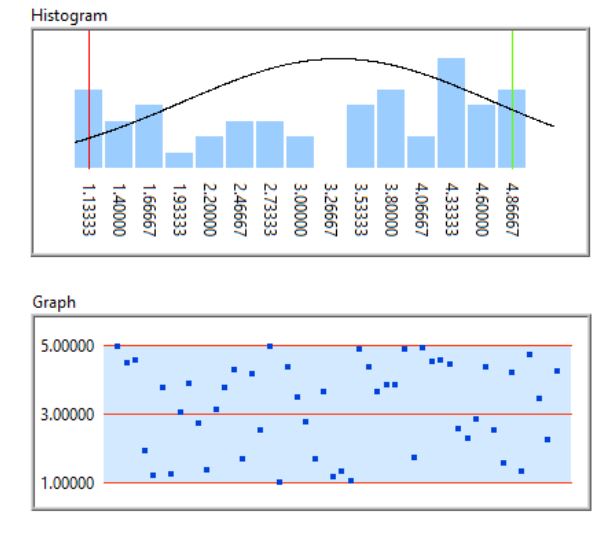
Example of a spread distribution (Cp: 0.51, Cpk: 0.46)
In this case, although all measured values fell within the preference range, the process capability is low and not robust. This requires further analysis: either the process under test is unstable or the repeatability of the measurement system is low.
The standard deviation may remain low, but the mean of the measured values slips towards one of the limits. This does not affect the Cp indicator, but the Cpk will decrease.
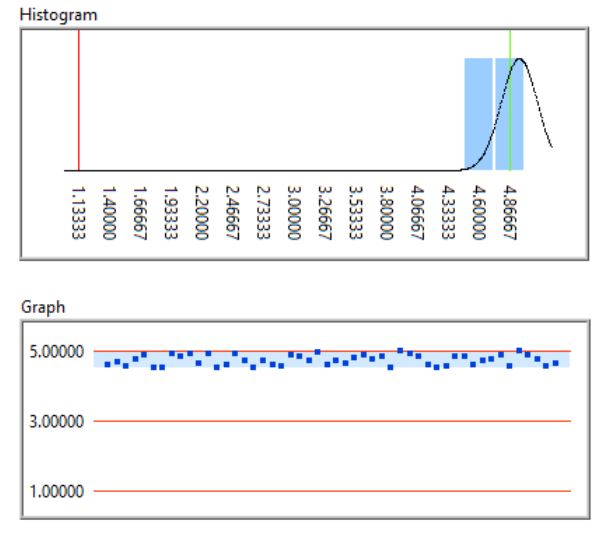
Example of a skewed distribution (Cp: 4.46, Cpk: 0.59)
This also indicates an unstable operation. The repeatability of the measurement system is good, but its absolute accuracy or the limits applied are incorrect.
Typical expectations for capability indicators
For these indicators, the higher the number, the more accurate the process. If the Cpk value is below 1.0, the process is inadequate and must be improved. A value between 1.0 and 1.33 is considered barely acceptable, above 1.33 is acceptable. Where possible, Cpk should be kept above 2.0. This means that the process uses half of the specified interval, so the possibility of error is reduced. The exact values are determined by the expected reliability and availability of the process.
Solutions provided by ProDSP
A ProDSP mint mérőrendszer-gyártó számára kiemelten fontos, hogy vevői elégedettek legyenek a leszállított mérőrendszerek teljesítményével, és megfelelő képességekkel rendelkező berendezéseket nyújtsunk, ezzel garantálva a problémamentes gyártást és megfelelő termékminőséget. Ezt elősegítve végátvétel előtt már mi magunk is validálunk minden elkészült tesztgépet. Ennek során megbizonyosodunk arról, hogy termékeink megfelelnek a vevő által és az általunk támasztott kritériumoknak is.
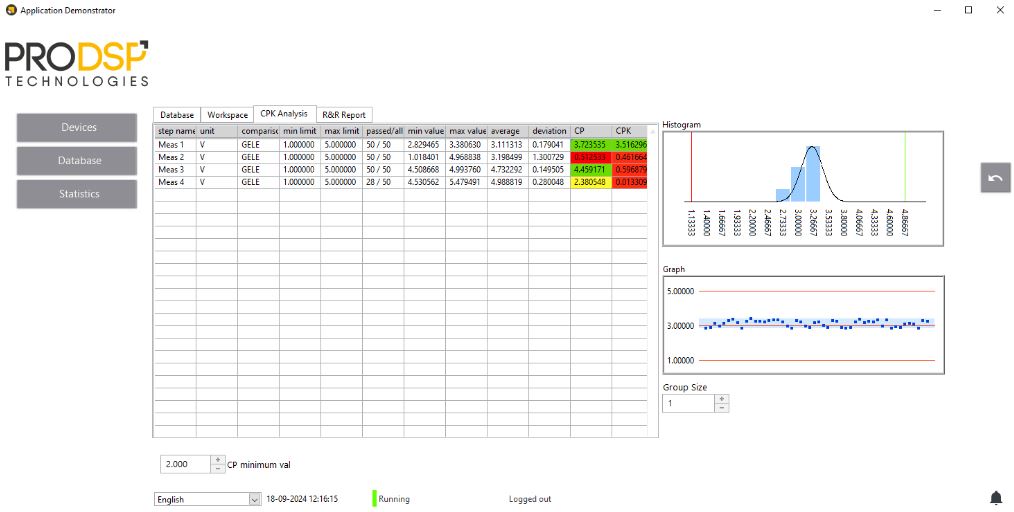
ProDSP Statistical Tool
For ProDSP as a measuring system manufacturer, it is important that our customers are satisfied with the performance of the delivered measurement systems and that we provide equipment with the right capabilities, guaranteeing trouble-free production and excellent product quality. To ensure this effort, we validate every completed test equipment ourselves before final acceptance. This ensures that our products meet the criteria set by the customer and us.
Tóth Eszter - Hardware design engineer
Boroznaki Dániel - Chief technical engineer


